FirstBeat Stress Assessments
®
Simple online booking >>
Understanding Your Lifestyle Stressors
Discover a fascinating view into how you really respond to stress in your life.
Lifestyle Stress Assessments
Chronic stress comes in two parts. Firstly, how we respond to trigger events in day to day life. Secondly, what we believe to be stressful causes us stress.
The latter is an interesting topic. What if you've been worrying about a particular aspect of your life that people have told you causes all your stress, only to find out it is not stressful at all. Maybe you deal with it just fine and it is actually something you never thought of that causes it instead.
A FirstBeat Lifestyle Assessment can shed light on this.
What is Heart Rate Variability (HRV)
Part of an EEG assessment you would get in a cardiac ward, HRV is a measure of the health of your nervous system. Specifically how it deals with stress.
By getting a constant reading over a 72 hour period it is possible to show in detail what things affect stress and recovery in your lifestyle. It measures the time between each beat of your heart as it is controlled by your nervous system. The more the time varies, the more relaxed you are. The more the times are consistently the same, the more stressed you are. With this information you can measure stress responses to daily triggers.

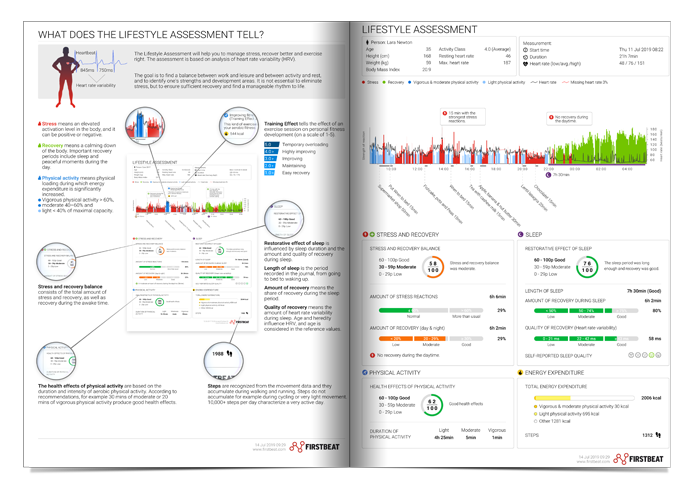
What does the chart mean?
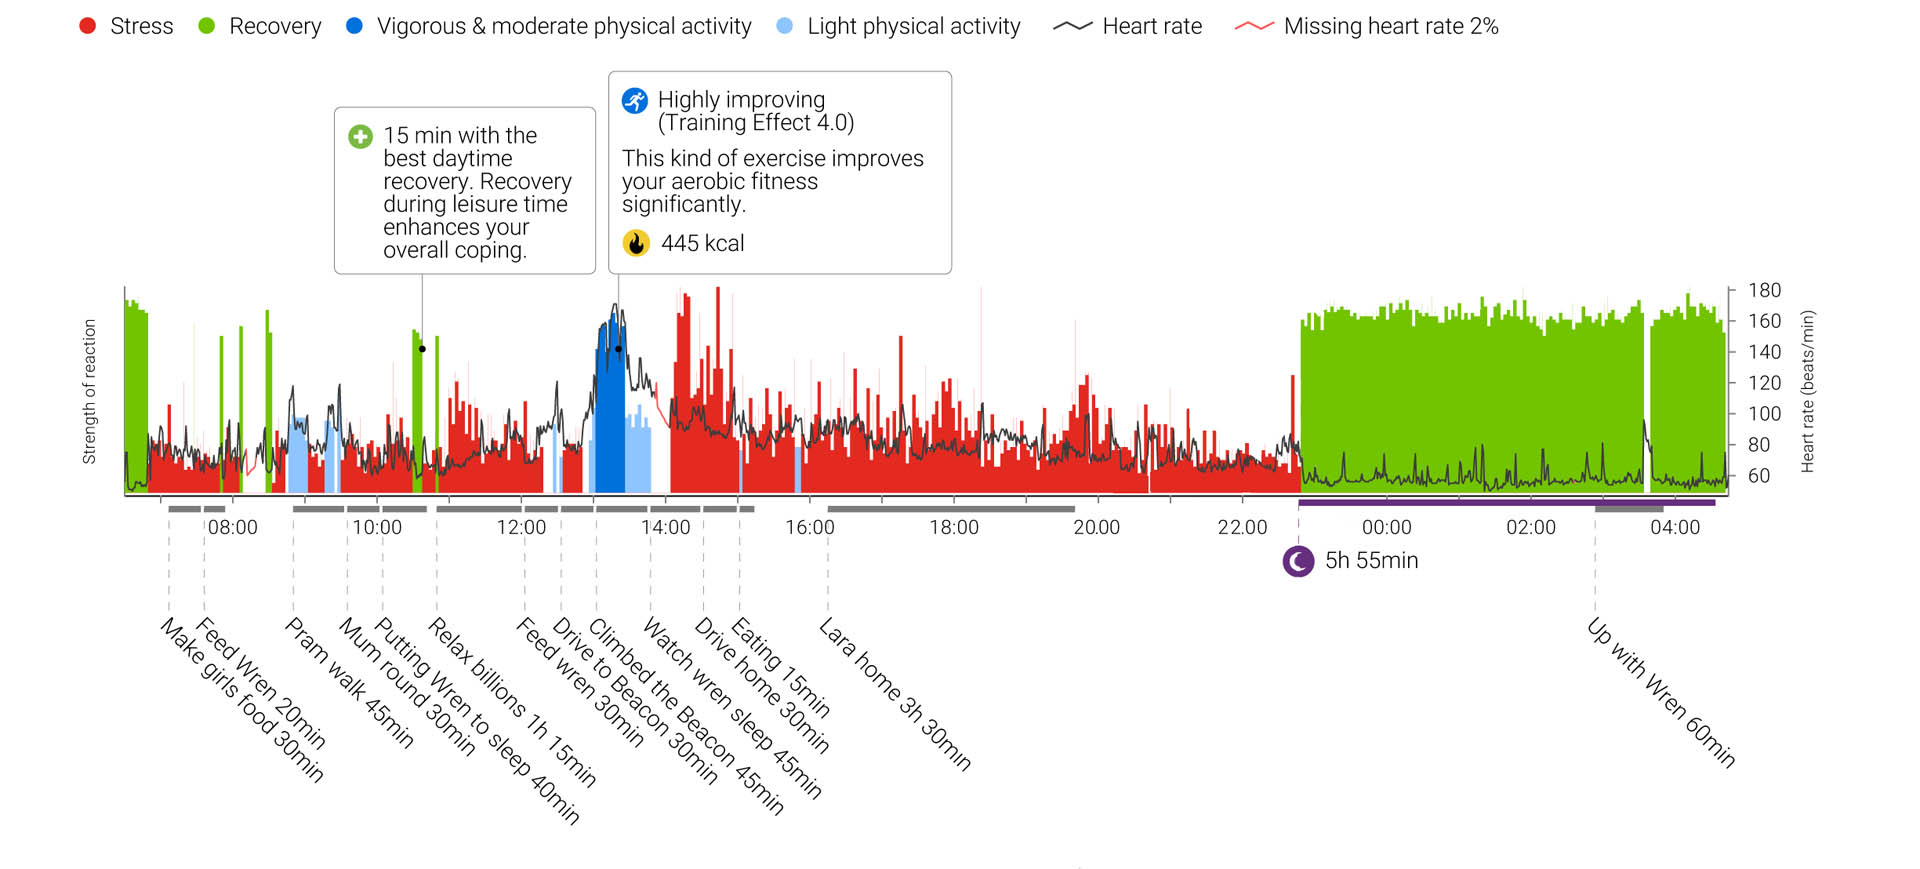
Red bars are daily stress. They should be seen throughout the waking hours as you go about your day. This is normal as our HRV is lower at times of activity.
Green bars show recovery, known as Parasympathetic activity. This is where your body goes through rest, recovery, digestion and tissue rebuilding. We should ideally see short bursts during the day and a solid block throughout sleep, like in the left hand chart below.
Light blue bars shows light activity, like walking. Here there is not enough of a heart rate increase to give a training effect, but enough to show good activity levels in the day.
Darker blue bars shows times of high intensity activity where you would get a training response. The heart rate will be closer to your maximum at these times. We can use this data to show the likely outcome for training effect and calculate the time needed for full recovery.


Analysis
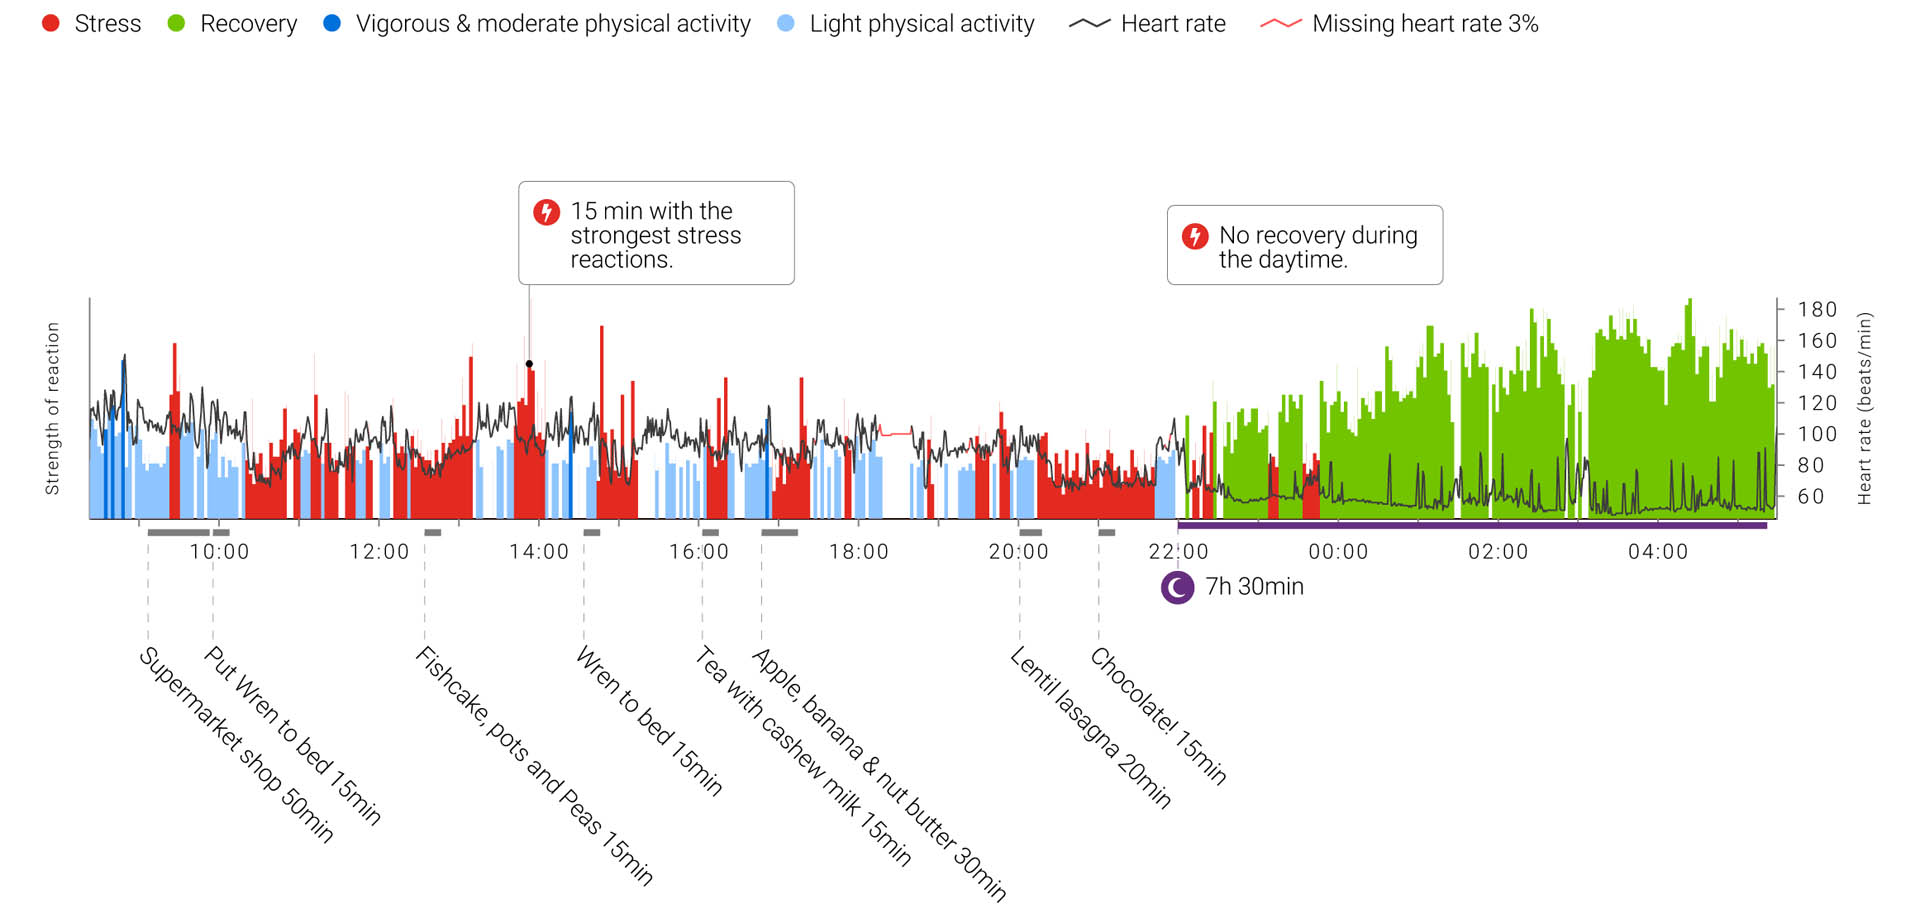
Above is a comparison of a father and mother. It shows a comparison of how each responds to spending the day alone, looking after their 13 month old daughter. On the left a very healthy 24 hour reading from the father, and on the right a very different reading from the mother. Let’s talk through the readings.
The left hand graph shows a pretty good result. One that we like to see from our clients. The red bars from daily activity are broken up by light blue and green, demonstrating good activity and recovery throughout the day. There is an area of darker blue showing a high activity exercise session too. Once we get to bed time, signified by the moon symbol, the bars turn green almost immediately, and remain green throughout the night. This shows that the patient got good recovery from the day and has an optimally performing nervous system and reacts calmly to the ups and downs of daily life with a 13 month old baby.
In contrast, the right hand graph has multiple areas of light blue throughout the day. This is what we might see with a warehouse worker, for example. It shows a person who performs light physical activity all the day. This client however had no more light physical activity than her husband over the same test and did not do any high intensity activity either. This result has been picked up through the monitor by assessing the heart rate variability, breathing rate calculation and the integrated movement sensor.
She complained of having chronic anxiety and exhaustion. Not unusual for a new mother to experience. The chart reveals that her sleep is not optimal and her daily stress responds in her nervous system like physical activity when it shouldn't.
When we discussed the results she could clearly see how it was her anxiety that peaked during these times. She could see how it was affecting her and why she was so tired all the time - she was effectively exercising all day, every day. You can even see she goes into this state right before bed, during her bed time routine.
The next step was to come up with a plan to reduce anxiety and slow her down a little. We could then do a follow up assessment to see if the changes she made had a positive effect on her or whether we needed to consider other forms of therapy to deal with anxiety.
Hopefully you can see here how interesting your results can be and how HRV analysis can shed light on how you really react to daily life.
Are you struggling with stress or exhaustion? This may help you uncover some clues too.
How does it work?
First of all we go through a thorough consultation of your concerns and set objectives for the test. This can be at the clinic or over Skype.
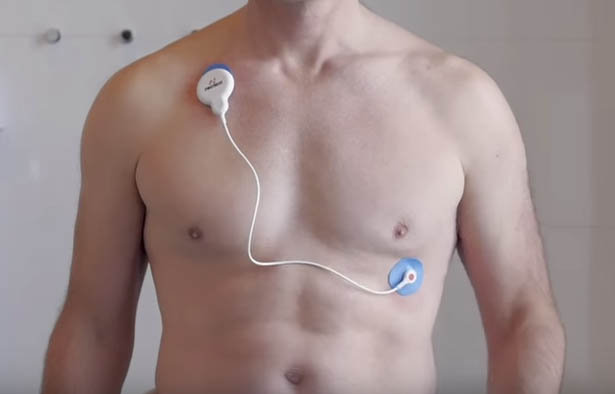
You'll then be asked to wear a heart rate device for 72 hours by placing two non-invasive electrodes on your skin. You will start wearing the device on the morning of the first test day and replace the electrodes each morning after that. Throughout the test period you'll keep a detailed diary on our online system, so we can match up life events to changes in stress responses.

Once the three day test is complete, you'll post the device back to us in the prepaid envelope supplied so we can analyse the collected data.
We will then arrange a consultation, either at the clinic or over Skype, to talk you through the results and discuss ways to reach your goals.
Who is HRV testing good for?
- Those that are concerned about stress in their life and want to learn how to make positive changes.
- People with ME, Chronic Fatigue or Fibromyalgia can benefit from learning what triggers them to have exhaustion flare ups.
- Those seeking sports or personal performance to achieve the most out of their recovery responses. HRV can show under or over training and under or over recovery. Helping you find the 'sweet spot'.
Pricing

Lifestyle Stress Assessment: £220
30 minute initial consultation
72 hour heart rate monitoring
Return postage of device
Full analysis of the data
Detailed 12 page report
30 minute results consultation